January 22, 2025
The Role of Tooling and Infrastructure in Measuring DORA Metrics

Chintan Viradiya
Author

Priyank Dhami
Contributor

Rakshit Menpara
Reviewer
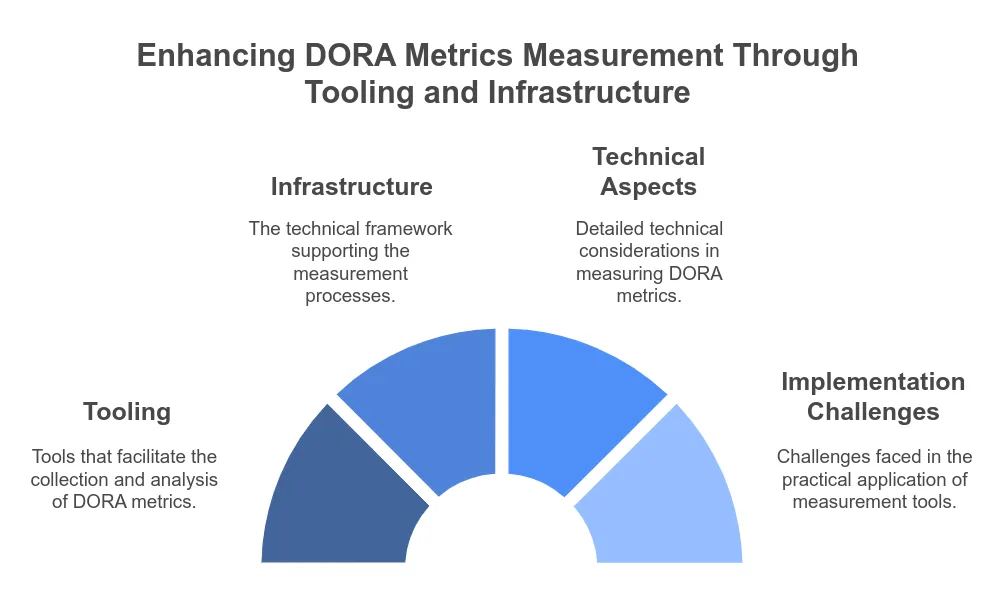
This discussion delves into the specific tools and infrastructure components that facilitate the collection, analysis, and reporting of DORA metrics, as well as the challenges associated with their implementation.
Understanding DORA Metrics
DORA metrics consist of four key performance indicators: deployment frequency, lead time for changes, mean time to restore (MTTR), and change failure rate. Each metric serves a distinct purpose in assessing the efficiency and effectiveness of software delivery processes.
-
Deployment Frequency: This metric quantifies the number of deployments to production within a specified timeframe. It reflects the team’s ability to deliver changes to users.
-
Lead Time for Changes: This metric measures the time taken from code commit to deployment in production. It indicates the efficiency of the development process.
-
Mean Time to Restore (MTTR): This metric calculates the average time taken to recover from a failure in production. It assesses the team’s responsiveness to incidents.
-
Change Failure Rate: This metric represents the percentage of deployments that result in a failure. It evaluates the stability of the deployment process.
Tooling for DORA Metrics
The measurement of DORA metrics requires a combination of tools that facilitate data collection, analysis, and visualization. The following categories of tools are essential for effective measurement:
Version Control Systems
Version control systems (VCS) such as Git play a crucial role in tracking code changes. They provide data necessary for calculating lead time for changes and deployment frequency. By analyzing commit history and deployment logs, teams can derive insights into their development cycles.
Continuous Integration/Continuous Deployment (CI/CD) Tools
CI/CD tools automate the process of building, testing, and deploying applications. Tools like Jenkins, GitLab CI, and CircleCI enable teams to monitor deployment frequency and lead time for changes. These tools generate logs that can be analyzed to determine the time taken for each stage of the deployment pipeline.
Incident Management Tools
Incident management tools such as PagerDuty and Opsgenie are vital for measuring MTTR and change failure rate. These tools track incidents, allowing teams to log the time taken to resolve issues. By integrating incident management with deployment tools, teams can correlate deployments with incidents, providing a clearer picture of change failure rates.
Monitoring and Observability Tools
Monitoring tools like Prometheus, Grafana, and New Relic provide insights into application performance and system health. These tools enable teams to detect failures and assess the impact of deployments on system stability. By analyzing metrics collected from these tools, teams can calculate MTTR and change failure rates.
Analytics and Reporting Tools
Analytics tools such as Google Analytics or custom dashboards built with tools like Tableau or Power BI can aggregate data from various sources. These tools allow teams to visualize DORA metrics over time, facilitating trend analysis and performance evaluation.
Infrastructure Considerations
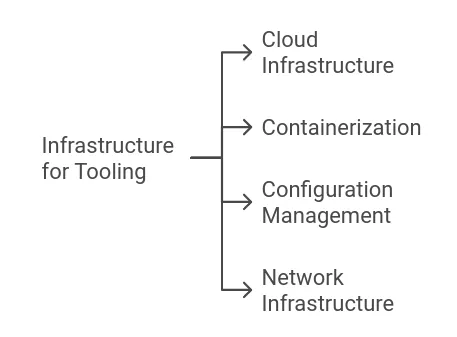
The infrastructure supporting the tooling is equally important in measuring DORA metrics. The following aspects should be considered:
Cloud Infrastructure
Cloud platforms such as AWS, Azure, and Google Cloud provide scalable environments for deploying applications. The use of cloud infrastructure can impact deployment frequency and lead time for changes. Teams must ensure that their cloud environments are configured for rapid deployment and recovery.
Containerization
Containerization technologies like Docker and orchestration tools like Kubernetes enable teams to deploy applications consistently across environments. These technologies can reduce lead time for changes and improve deployment frequency by simplifying the deployment process.
Configuration Management
Configuration management tools such as Ansible, Puppet, and Chef automate the provisioning and management of infrastructure. These tools ensure that environments are consistent and can be quickly restored in case of failure, thereby impacting MTTR.
Network Infrastructure
The network infrastructure must support the rapid deployment of applications. Latency and bandwidth can affect the speed of deployments and the ability to restore services after a failure. Teams should monitor network performance as part of their DORA metric analysis.
Challenges in Measuring DORA Metrics
While tooling and infrastructure are critical for measuring DORA metrics, several challenges can arise:
Data Silos: Data silos occur when information is isolated within different tools or teams. This fragmentation can hinder the ability to collect comprehensive data for DORA metrics. Integrating tools and ensuring data flows between them is essential for accurate measurement.
Inconsistent Data: Inconsistent data can arise from manual processes or poorly configured tools. Ensuring that all tools are correctly set up to capture relevant data is necessary for reliable metric calculation.
Cultural Resistance: Cultural resistance to adopting new tools or processes can impede the measurement of DORA metrics. Teams must foster a culture of continuous improvement and data-driven decision-making to overcome this challenge.
Tool Overhead: The integration of multiple tools can introduce complexity and overhead. Teams must balance the benefits of detailed measurement with the operational burden of managing numerous tools.
Consequences of Insufficient Tooling and Infrastructure
Poor data quality can severely impact organizational performance. Inaccurate conclusions drawn from flawed data lead to misaligned priorities and ineffective process improvements. Incomplete metrics hinder the identification of bottlenecks and inefficiencies, prolonging delivery cycles and increasing costs. The inability to measure and address change failure rates and recovery times can lead to higher system downtime, eroding user trust. Insufficient integration across tools and infrastructure limits the ability to automate key processes, resulting in higher manual effort and increased error rates.
Conclusion
The measurement of DORA metrics is contingent upon the effective use of tooling and infrastructure. Each component plays a vital role in collecting and analyzing data necessary for evaluating software delivery performance. However, challenges such as data silos, inconsistent data, cultural resistance, and tool overhead can hinder accurate measurement.
Organizations must address these challenges to ensure that their tooling and infrastructure support the effective measurement of DORA metrics. Failure to do so may result in an incomplete understanding of software delivery performance, leading to suboptimal decision-making and potential degradation of service quality. The consequences of neglecting these aspects can manifest in increased lead times, higher change failure rates, and prolonged recovery times, ultimately impacting the organization’s ability to deliver value to its users.
Frequently Asked Question
Get quick answers to common queries. Explore our FAQs for helpful insights and solutions.
DORA metrics are a set of four key performance indicators that measure software delivery and operational performance. Defined by the DevOps Research and Assessment team, they help organizations understand how effectively they deliver software while maintaining stability and reliability.
The four core DORA metrics are:
- Deployment Frequency - How often code is deployed to production
- Lead Time for Changes - How quickly code moves from commit to production
- Change Failure Rate - Percentage of deployments causing incidents or failures
- Mean Time to Recovery (MTTR) - How fast services recover from failures
Manual tracking is error-prone, inconsistent, and doesn’t scale. As delivery pipelines grow more complex, reliable DORA measurement requires automated data collection across CI/CD, monitoring, incident management, and version control systems.
Accurate DORA measurement typically requires:
- CI/CD tools to track deployments and lead times(GitHub Actions, or GitLab CI)
- Version control systems to capture commit history(GitHub or GitLab)
- Monitoring and observability platforms to measure failures and recovery(Prometheus, Datadog, or New Relic)
- Incident management tools to correlate incidents with deployments(Grafana)
Observability provides the data needed to measure:
- When failures occur
- How quickly systems recover
- Whether deployments degrade user experience. Without observability, metrics like MTTR and Change Failure Rate become assumptions rather than facts.
Written by
Chintan Viradiya
Chintan Viradiya is a DevOps Engineer at Improwised Technologies. Passionate about Infrastructure as Code and CI/CD pipelines, he focuses on optimizing cloud deployments and enhancing the security and performance of modern applications. He plays a key role in ensuring high availability and driving DevOps best practices across projects


March 25, 2026
Secure Intra-Cluster Networking in Kubernetes Through WireGuard
Chintan Viradiya
Author


February 12, 2026
DevSecOps Architecture Explained: Security as Code, Policy Automation, and GitOps
Chintan Viradiya
Author


January 22, 2026
FluxCD with Helm: Scaling Platform Governance via GitOps Reconciliation
Chintan Viradiya
Author
Optimize Your Cloud. Cut Costs. Accelerate Performance.
Struggling with slow deployments and rising cloud costs?
Our tailored platform engineering solutions enhance efficiency, boost speed, and reduce expenses.